This paper describes a parallel implementation of the Game of Life for a single machine.
The implementation consists of two K scripts: a viewer script, responsible for the process which manages the GUI and controls the worker processes, and a worker script, which computes the subregions which run in parallel as the life universe evolves.
To run, download both scripts, and one or both of the pattern directories: patterns, or jspatterns.
Install all four objects at the same level, e.g. in c:\plife\.
The viewer is started:
k v
or
k v path-to-pattern-directory
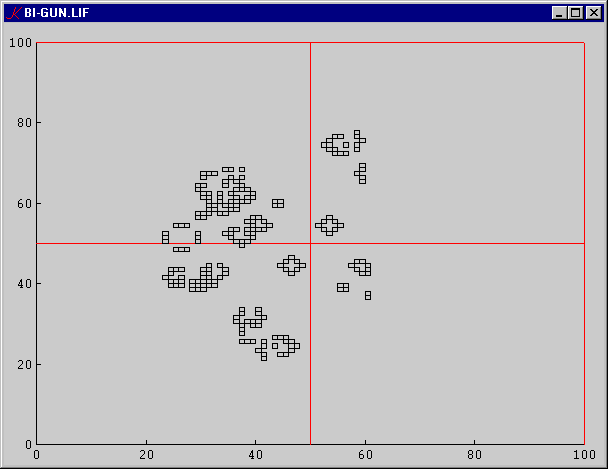
and a life-pattern is selected. For example:
The variables S and N are initialized to 0. S must be set to a value >= to the size of the pattern, and N must be set to a value > 0 which evenly divides S. N represents the size of each parallel region. For example, if S is set to 100 and N to 50, then the universe will be divided into four regions:
The L variable controls cycle-detection. For example, if L is set to 3, then cycles of length <= 3 will be detected. When a cycle is detected, the workers are stopped and the system goes into idle mode.
Consider a universe partitioned into 3 x 3 regions:
| A | B | C |
| D | E | F |
| G | H | I |
Suppose each region consists of a 4 x 4 array of cells:
0 1 2 3 4 5 6 7 8 9 10 11 12 13 14 15
Each region depends on eight neighboring regions. Cells along the north, south, east and west edges (including the corners) cannot be computed without information about the cells which border them. For example, at each step in the evolution of region E, information about cells at the edges of A, B, C, D, F, G, H, and I must be available. Schematically:
NW N N N N NE W 0 1 2 3 E W 4 5 6 7 E W 8 9 10 11 E W 12 13 14 15 E SW S S S S SE
For E, the sub-universes at the eight compass-points are:
A B B B B C D 0 1 2 3 F D 4 5 6 7 F D 8 9 10 11 F D 12 13 14 15 F G H H H H I
Initially, the viewer must start all the workers. In the current single-machine implementation, the viewer and all workers run on the same machine.
The viewer process assigns itself the port 100.
There are B*B worker processes to start, where B = S % N. When worker i starts, it assigns itself the port 100+i+1, and immediately connects to the viewer. On connection, the viewer stores the handle _w in W[i], and sends a 'connect' message to the worker. This message contains two pieces of information: N, the size of the region, and U, the initial state of the region. U is &,/M, where M is a (conceptual) boolean matrix. M is never materialized.
When all workers have connected, the viewer sends to each worker information about the workers at its eight compass points. For example, in the 3x3 example above, the port numbers of the nine workers are:
A  101
B  102
C  103
D  104
E  105
F  106
G  107
H  108
I  109
and the viewer sends to worker E the information:
NW  101
N   102
NE  103
E   104
SE  106
S   107
SW  108
W   109
On receipt of this information, the worker connects to each neighboring worker.
Finally, the viewer instructs each worker to compute the next state of its region.
The algorithm for computing the next state of a region is:
The viewer sends each of the B*B workers a 'set' message. On receipt of the message, the worker sends its four edges and four corners to the appropriate neighboring workers. When a worker receives an edge it updates its array and increments its tally variable T. When T=8, all edges and corners have been received and incorporated, T is reset to 0, and the next state of the universe is computed. The differences between the new state and the old state are computed: cells which were off and are now on; and cells which were on and are now off. This information is sent to the viewer process. The viewer process updates its array and increments its tally variable T. When T = B*B, the total number of workers, the universe is redisplayed, T is reset to 0, and the algorithm repeats.
The viewer must have a list of machines on the network, and contain some method for assigning workers to machines. The simplest method would seem to consist of distributing workers evenly among the available machines.
More importantly, a starter process or service must be running on each of these machines through whose agency the viewer can start processes on that machine. Instead of directly starting a worker, the viewer will send a message to the starter consisting of the name of the viewer-machine M and a list of ports to use for the workers on the starter's machine. Each worker will then connect back to (M;100). Furthermore, workers will have to broadcast edge-and-corner information to workers on remote machines, so the 'neighbor' message from viewer to worker will need to be enhanced to contain machine information.
The techniques involved are well-understood.
The effective limits to scaling are set by addressability. The total size of the universe can't exceed 0I cells (i.e. max-int). A 64-bit K4 implementation would effectively remove this limitation, but in practice physical memory sets a limit which is much smaller. But we can envision a design which allows us to scale up to very large universes.
We have, at the top of the hierarchy, a controller process. The controller divides the universe into B*B super-regions. A super-region is either a worker (as now), or a further controller, &c. Eventually, the tree of controllers bottoms out in a set of workers, each of which manages a region of workable size. Although we can't view the entire universe at once, we can view any part of it. In our current representation, each region is implicitly assigned a pair of integers which represent the row- and column-displacement of the worker's region in the overall universe. In the hierarchical design, each controller process has a pair of integers which represents its displacement in the region of the controller just above. So each worker in the hierarchy of sub-universes would have a unique k x 2 matrix of displacements, where k is the depth of the worker in the hierarchy.
In this scheme, controllers don't assemble the results of their sub-processes, even in the case where a controller is managing only workers. Instead, viewing is demand-driven in the following way. We start at the top controller and pick a sub-region from the "region map" GUI. A 'view' message is sent to the corresponding process. If the receiving process is a controller, we pop up another region map. If the receiving process is a worker, we pop up a display of its universe.
Again, the techniques involved are well-understood, and shouldn't be difficult to implement. We need three scripts: controller, starter, and worker.
Our use of the K plot widget is, of course, a hack, in the sense that it was never meant to be used as a canvas for arbitrary drawing. K4 will not even contain a native GUI, so this is one item on the to-do list for anyone contemplating a K4 GUI.