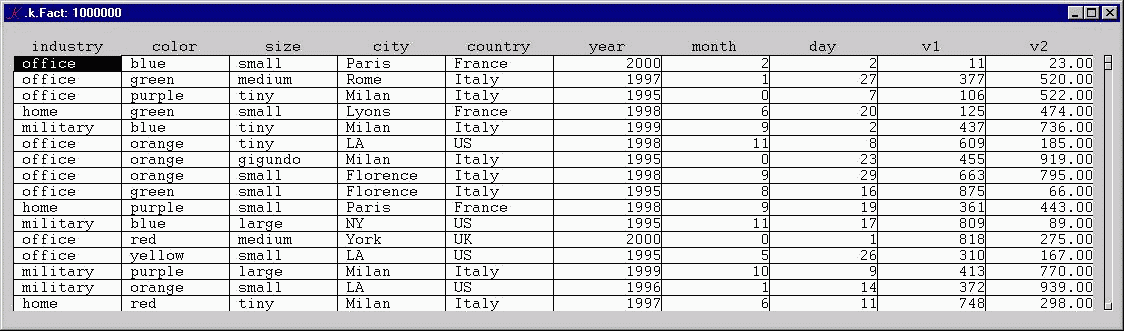
Each record in the Fact table is a transaction:
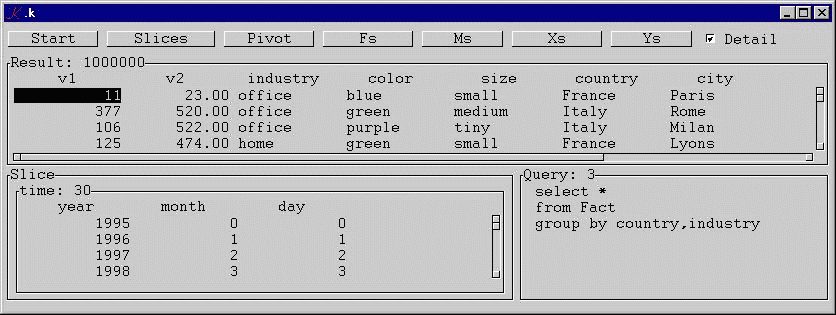
For example, the first record records a transaction with values v1 = 11 and v2 = 23 for a small blue office product in Paris, France on 2.2.2000.
There are two kinds of fields in the Fact table: Dimension fields, such as industry and year, and value fields, such as v1 and v2.
Dimension fields are hierarchically ordered within a dimension: the Product dimension is industry -> color -> size.
The initial view of the Fact table summarizes all values to the outermost level of two dimensions:
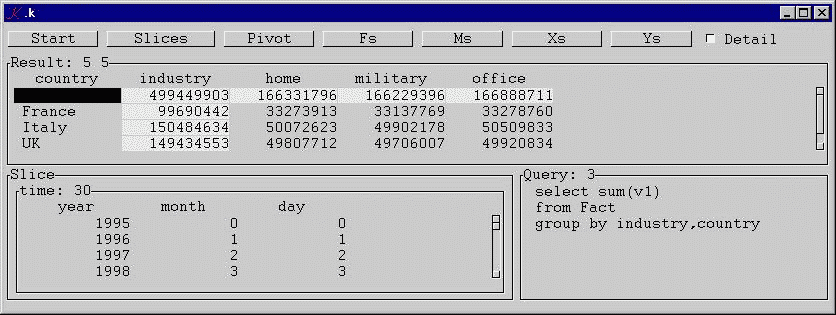
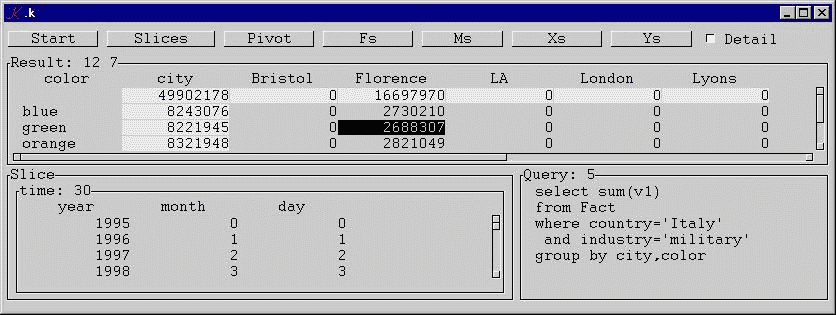
The OLAP window contains three components: a Results window, showing the aggregated data; a Slice control, which can be used to select within dimensions; and the Query window, which shows the SQL which generates the sliced result.
Additional controls along the top of the form:
Start resets the view to the initial aggregation.
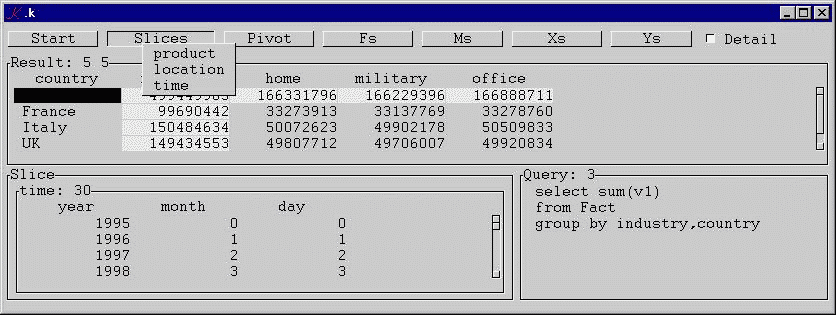
Slices picks the dimension to slice:
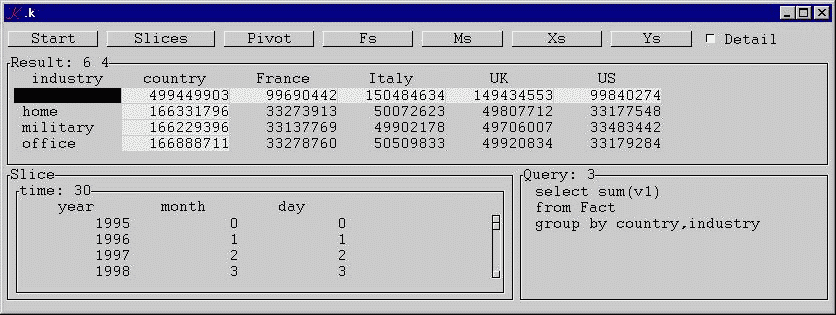
Pivot swaps the X and Y axes:
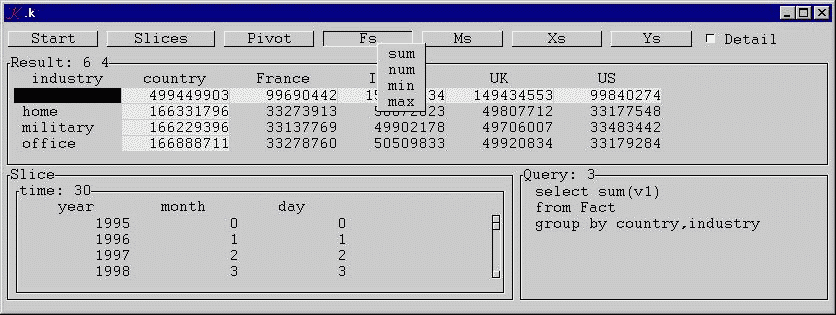
Fs selects the aggregation function:
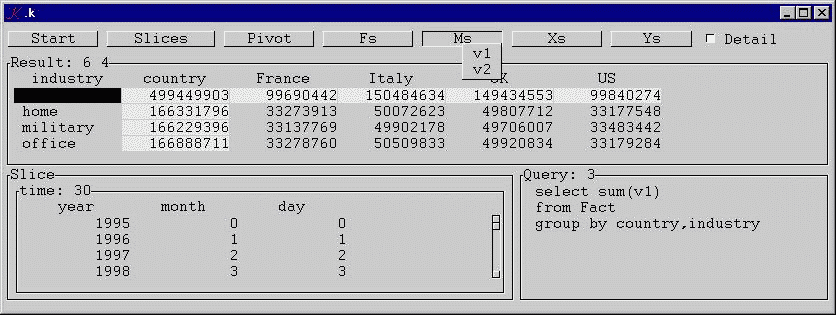
Ms selects the value to aggregate:
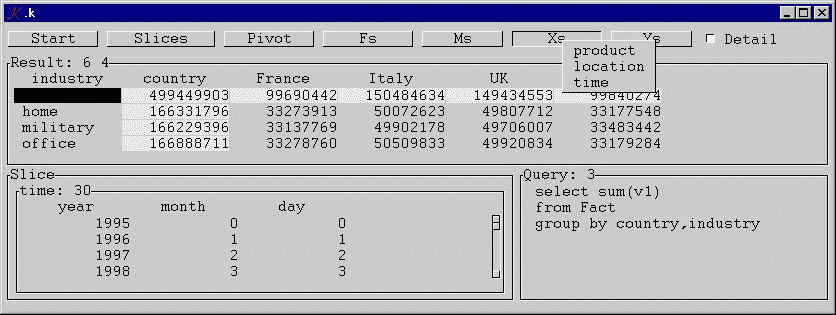
Xs selects the X dimension:
Ys selects the Y dimension:

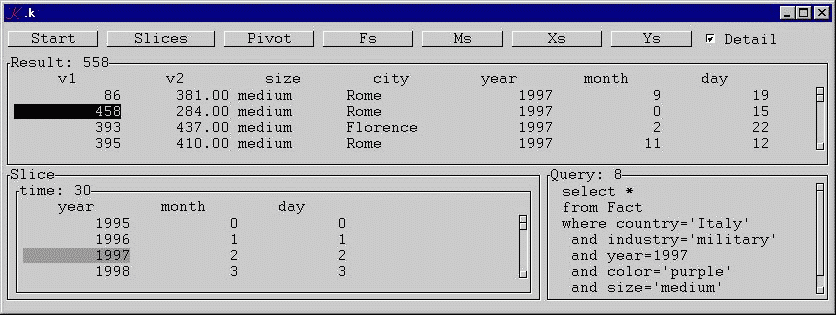
and Detail shows the records in the Fact table underlying the current aggregation:
Clicking a cell in the Result table drills down into the aggregation. For example, Military + Italy =
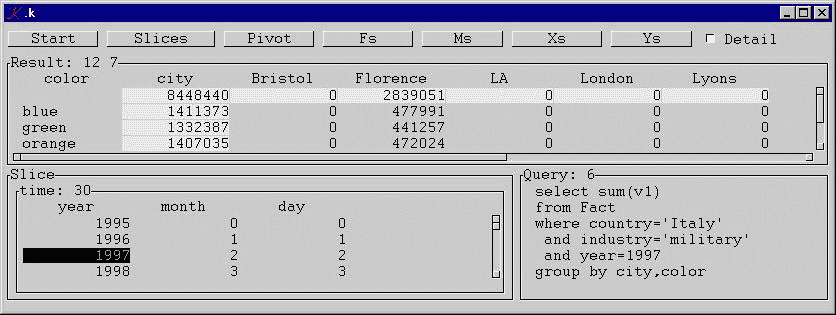
For year 1997 only:
Clicking on an element in the row or column dimension disaggregates on that dimension only; for example, color = purple:
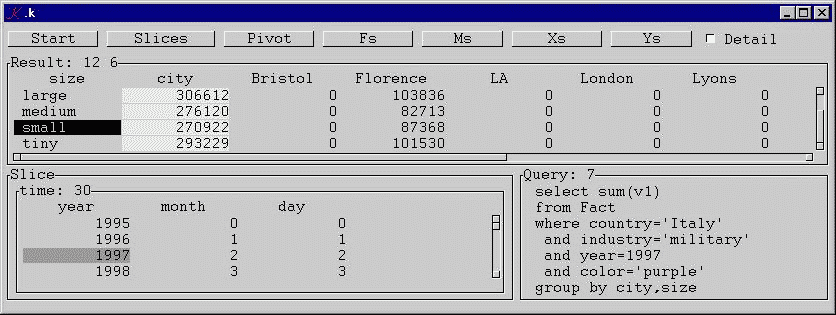
Observe that disaggregation on a dimension (or pair of dimensions) explodes the results into the next subdimension (or subdimensions). For example, disaggregating on Product.color = purple -> Product.size.
When disaggregation "bottoms out" on a dimension, the display shifts to show the underlying detail records. For example, clicking on size = medium produces:
The K implementation is about a page of code.
First, we set the fonts to something non-proportional:
	\m f Courier-New
	\m l Courier-New
Then we define the Fact table. In a "real" application, we would read the table and its structural parameters off disk. In this demo version, we simply generate the data.
N:1000000
	Fact.industry:`home`office`military N _draw 3
	Fact.color:`red`blue`green`yellow`orange`purple N _draw 6
	Fact.size:`tiny`small`medium`large`gigundo N _draw 5
	Fact.city:t N _draw#t:`NY`LA`London`York`Bristol`Rome`Milan`Florence`Paris`Lyons
	Fact.country:(.+(t;`US`US`UK`UK`UK`Italy`Italy`Italy`France`France))Fact.city
	Fact.year:1995 1996 1997 1998 1999 2000 N _draw 6
	Fact.month:N _draw 12
	Fact.day:N _draw 30
	Fact.v1:N _draw 1000
	Fact.v2:1.*N _draw 1000
In our example, we will generate a million records (N) of random integer (v1) and float (v2) data. Notice that we need to do a little extra work to make sure that cities are generated in the right countries.
A function to derive the sorted, unique dimension values:
nub:{.+(x;{{x@<x}@?x}'Fact x)}
And the structural parameters of the Fact table:
	H[`product`location`time]:nub'(`industry`color`size;`country`city;`year`month`day)
    	I..d:"@[H;_n;*!:]"
    	Q..d:"H;.()"
    	F..d:"H;*!T"
    	M..d:"*(!Fact)_dvl,/!:'H[]"
    	X..d:"H;*!`I"
    	Y..d:"H;(!`I)1"
A pair of functions to handle NA's and Infinities:
	nan:(0N;0n;;`)@- 1+4::
    	inf:(0I;0i)@- 1+4::
Aggregation functions:
	T[`sum`num`min`max]:(+/;+/;&/;|/)
   	sum:{x#@[(*/x)#*0#z;x _sv y;+;z]}
  	num:{z;x#@[&*/x;x _sv y;+;1]}
  	min:{x#@[(*/x)#inf z;x _sv y;&;z]}
   	max:{x#@[(*/x)#-inf z;x _sv y;|;z]}
The Results window, defined as a dependency:
	Z..d:":[Detail;detail[I]Q;drill[I;Q;X;Y;F]M]"
    	Z..l..d:"\"Result:
    	\",:[.k.Detail;$*|^.k.Z[];1_,/\"
    	\",'$^.k.Z[]]"
The heart of the program is the drill-down function:
	drill:{[i;q;x;y;f;m]
    	 n:#:'s:{H[x;i x]}'x,y
    	 d:f[n;s?/:'Fact[i x,y;j];Fact[m;j:true q]]
    	 d:(,nan[s 1],s 1),(,/T[f]'(,/d;+d)),'(,T[f]d),d
    	 a:.+(`e`k`bg;(0;".k.k[*_i].k.vn[]";bg))
    	 t:.+(i[y,x],g:`$"x",'$!*n;d;a)
    	 .[t;(~g;`l);:;$*s]}
true:{[q]{x@&z=Fact[y;x]}/[_n;!q;q[]]}
A function to get the detail records underlying the current aggregation:
	detail:{[i;q].+(f;Fact[f:df i;true q];.,`e,0)}
    	df:{[i]((!Fact)_dvl,/!:'H[]),,/(!i){((!H x)?y)_!H x}'i[]
Background color:
	vn:{`$(1+#$_d)_$_v}
    	bg:{:[((0=*_i)&~v=I Y)|I[X]=v:vn[];909090]}
Click function:
	k:{:[(y=I Y)&x>0;ky x;(~y=IX)&x>0;kx[x]y]}
    	nx:{(x,*|x)1+x?y}
	kx:{
    	 Q[I X,Y]:(H[X;I X;-2+(!Z)?y];H[Y;I Y;-1+x])
    	 if[I[X,Y]~i:(nx[!H X]I X;nx[!H Y]I Y);Detail::1]
     	 I[X,Y]:i
    	 }
	ky:{
    	 Q[I Y]:H[Y;I Y;-1+x]
    	 if[I[Y]~i:nx[!H Y]I Y;Detail::1]
    	 I[Y]:i
   	 }
And the GUI:
	Start:"H::;Detail:0"
    	Pivot:"@[_d;`X`Y;:;Y,X];"
    	Slices..d:".+(!H;(#!H)#,\"Slice..a:_i\")"
    	Xs:@[H;_n;:[;"if[~_i=Y;X:_i]"]]
    	Ys:@[H;_n;:[;"if[~_i=X;Y:_i]"]]
    	Fs:@[_n;!T;:[;"F:_i"]]
    	Ms:@[_n;(!Fact)_dvl,/!:'H[];:[;"M:_i"]]
    	Start..c:Pivot..c:Slices..c:Ms..c:Fs..c:Xs..c:Ys..c:`button
    	Detail:0
    	Detail..c:`check
    	query:{[d;i;q;x;y;f;m]select[d;f;m],where[q],,group[i;x]y}
    	select:{[d;f;m]("select",:[d;"*";($f),"(",($m),")"];"from Fact")}
    	where:{[q]:[0=#!q;();@[" and ",/:($!q){x,"=",value y}'q[];0;"where ",5_]]}
    	value:{:[4=4:x;"'",($x),"'";$x]}
    	group:{[i;x;y]"group by ",($i x),",",$i y}
    	Query..d:".k.query[Detail;.k.I;.k.Q;.k.X;.k.Y;.k.F].k.M"
    	Query..e:0
    	Slice..d:"sliced/[.+(!H;{.+(!x;x[];slicea[])}'H[]);!Q;Q[]]"
    	Slice..t:"if[`X _in _i;Q:slice[Q]Slice]"
    	Slice..c:`form
    	Slice..a..d:"*((!.k.H)_dvl .k.X,.k.Y),!.k.H"
    	slicea:{.+(`e`k`X`bg;(0;".k.c[]";();.k.bgc))}
    	sliced:{.[x;((!x)(y _in'!:'x[])?1;~y;`X);:;z]}
    	c:{@[~_v;`X;:;(d;0#d)(d:_v ._i)~(~_v)`X];.[_v;();::];}
    	bgc:{(;606060)(_v ._i)_in(),(~_v)`X}
    	slice:{[q;s]{x _di(!x)@&0=#:'x[]}q{@[x;!y;:;y[.;`X]]}/s[]}
    	.k..a:(`Start`Slices`Pivot`Fs`Ms`Xs`Ys`Detail;`Z;`Slice`Query)
    	`show$`.k